Case Study: Suzuki Manufacturing Quality Assurance Dashboard
📊 Project Overview
In a high-volume manufacturing environment, identifying the root cause of defects is critical to reducing waste and maintaining brand standards. I developed this interactive Power BI Dashboard for a Suzuki assembly/parts division to provide real-time visibility into production defects, vendor performance, and specific part failures.
-
Role: Data Analyst / BI Developer
-
Tools Used: Power BI, Power Query, DAX
-
Key Metrics: Total Defects, Vendor Error Rates, Defect Categories (AB/AR), Part-Specific Failures.
🛠 The Challenge
The quality control team was struggling with fragmented data. They needed a way to:
-
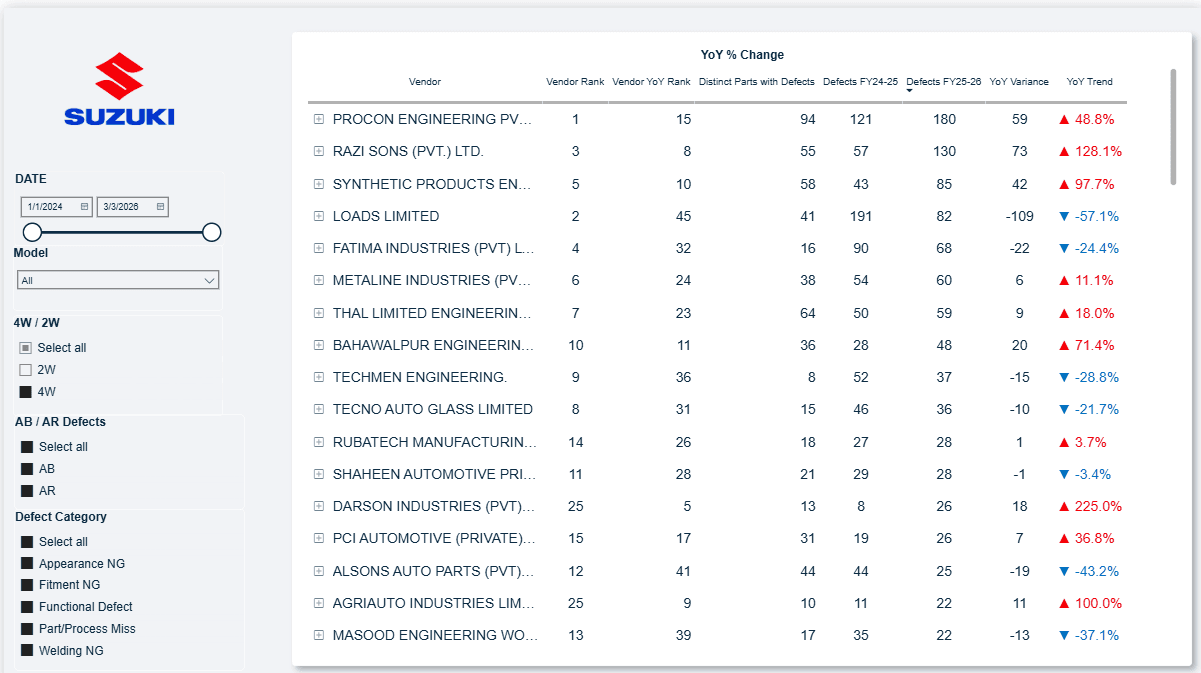
Identify Underperforming Vendors: Who is supplying the most defective parts?
-
Pinpoint Specific Part Issues: Which specific components (e.g., "Bolt with Washer") are failing most frequently?
-
Drill-Down Capability: Move from a high-level overview of total defects down to the specific description of why a part failed (e.g., "Bracket hole misalignment").
💡 The Solution
I designed a multi-view dashboard that balances high-level KPIs with granular "Drill-Through" functionality.
1. Executive Overview
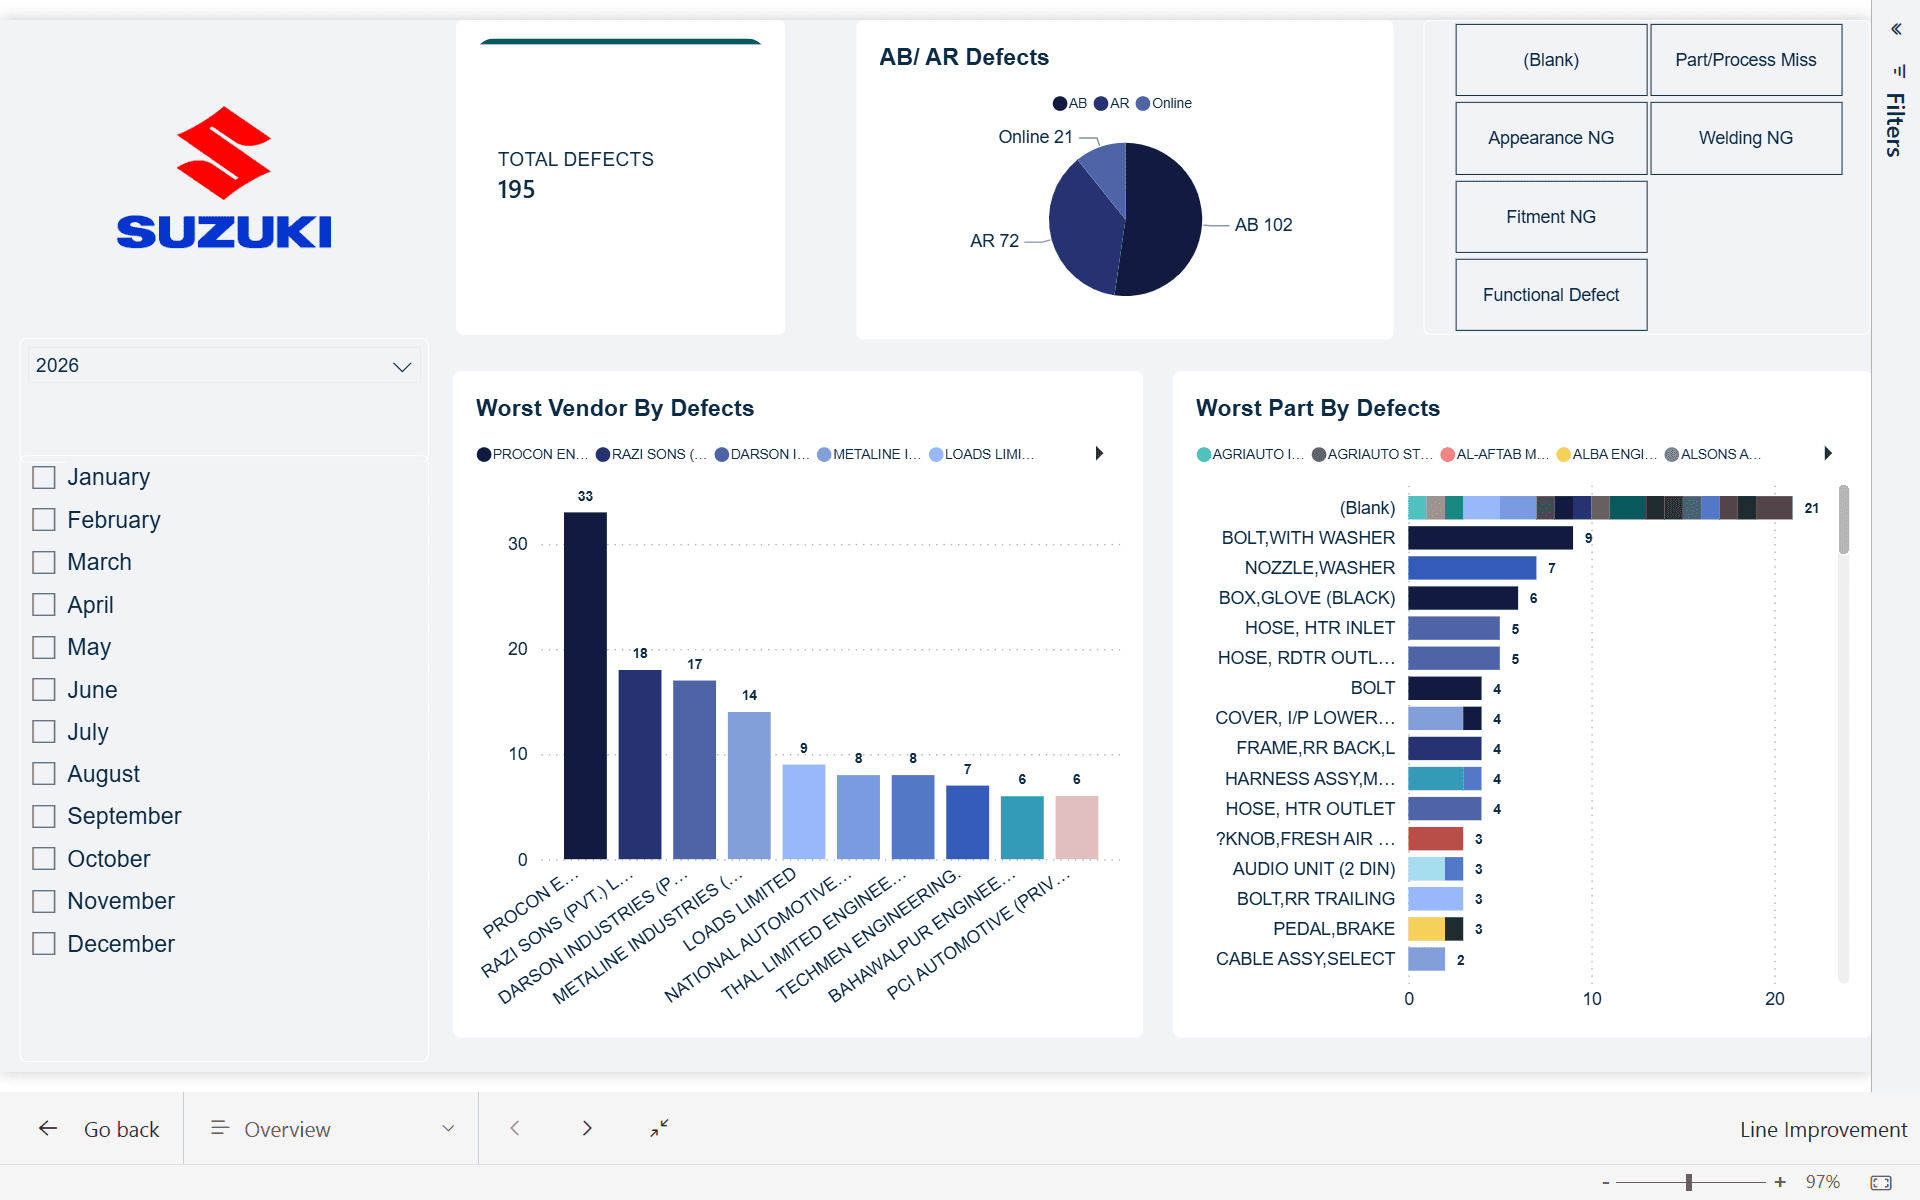
The main landing page provides an immediate snapshot of quality health.
-
KPI Cards: Displaying "Total Defects" to track volume at a glance.
-
AB/AR Defect Split: A donut chart showing the ratio of specific defect types.
-
Dynamic Filtering: Users can filter by Month (January–December 2026) to track seasonal or production-run trends.
2. Vendor & Part Analysis
To drive accountability, I implemented:
-
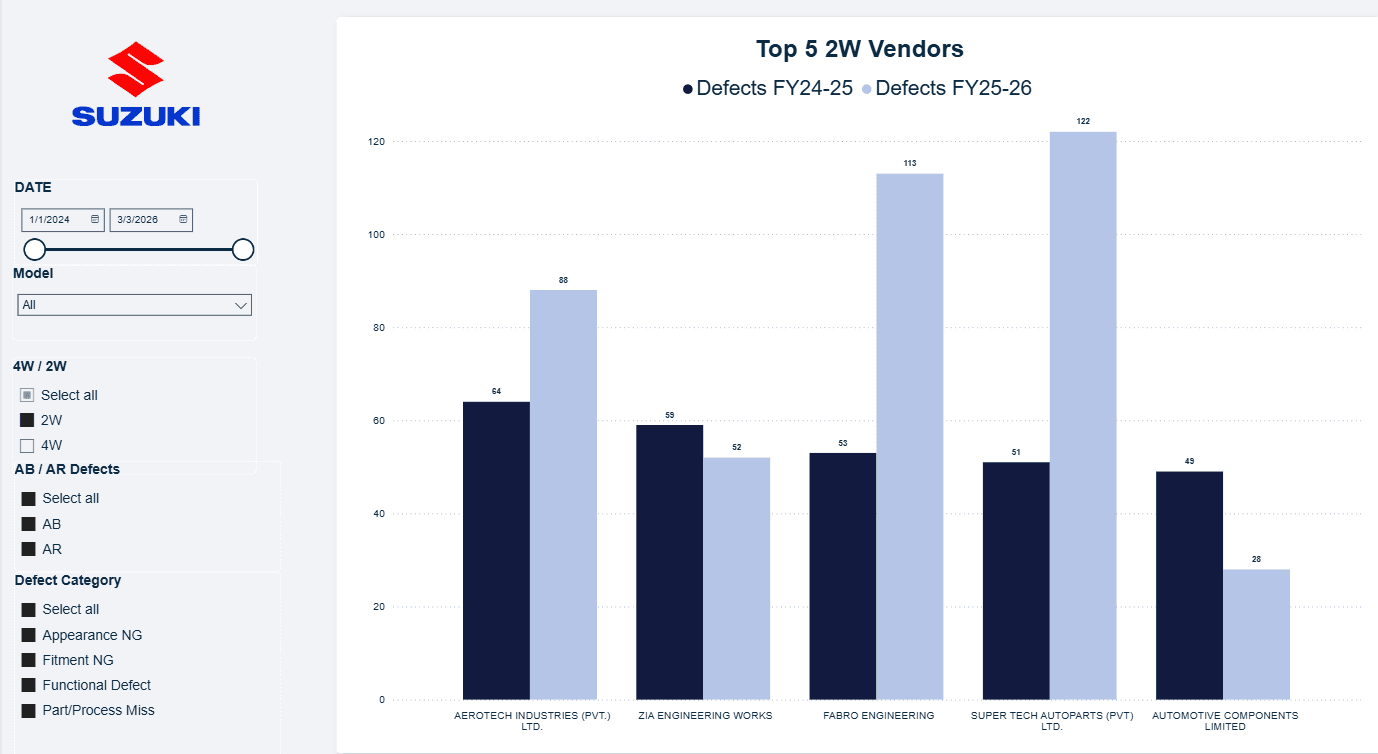
Worst Vendor Bar Chart: A ranked list of suppliers contributing to defects, allowing procurement teams to initiate quality audits.
-
Worst Part Bar Chart: Identifies the "usual suspects" in the assembly line—highlighting parts like "Nozzle Washer" and "Box Glove."
3. Advanced Drill-Down Features
The "Defect Description View" allows users to click a specific part and see the exact reason for failure.
- Example: Selecting "Bolt with Washer" reveals specific issues like "Dashboard bolt not fit" or "Bracket hole misalignment." This bridges the gap between data and engineering action.
📈 Impact & Results
-
Reduced Response Time: Quality managers can now identify a spike in vendor defects in seconds rather than hours of manual spreadsheet auditing.
-
Targeted Quality Audits: By identifying the "Top 5 Worst Vendors," the company can focus its auditing resources where they are needed most.
-
Improved Communication: The "Defect Description View" provides the engineering team with the exact technical reason for failure, streamlining the feedback loop to the factory floor.