Back to Projects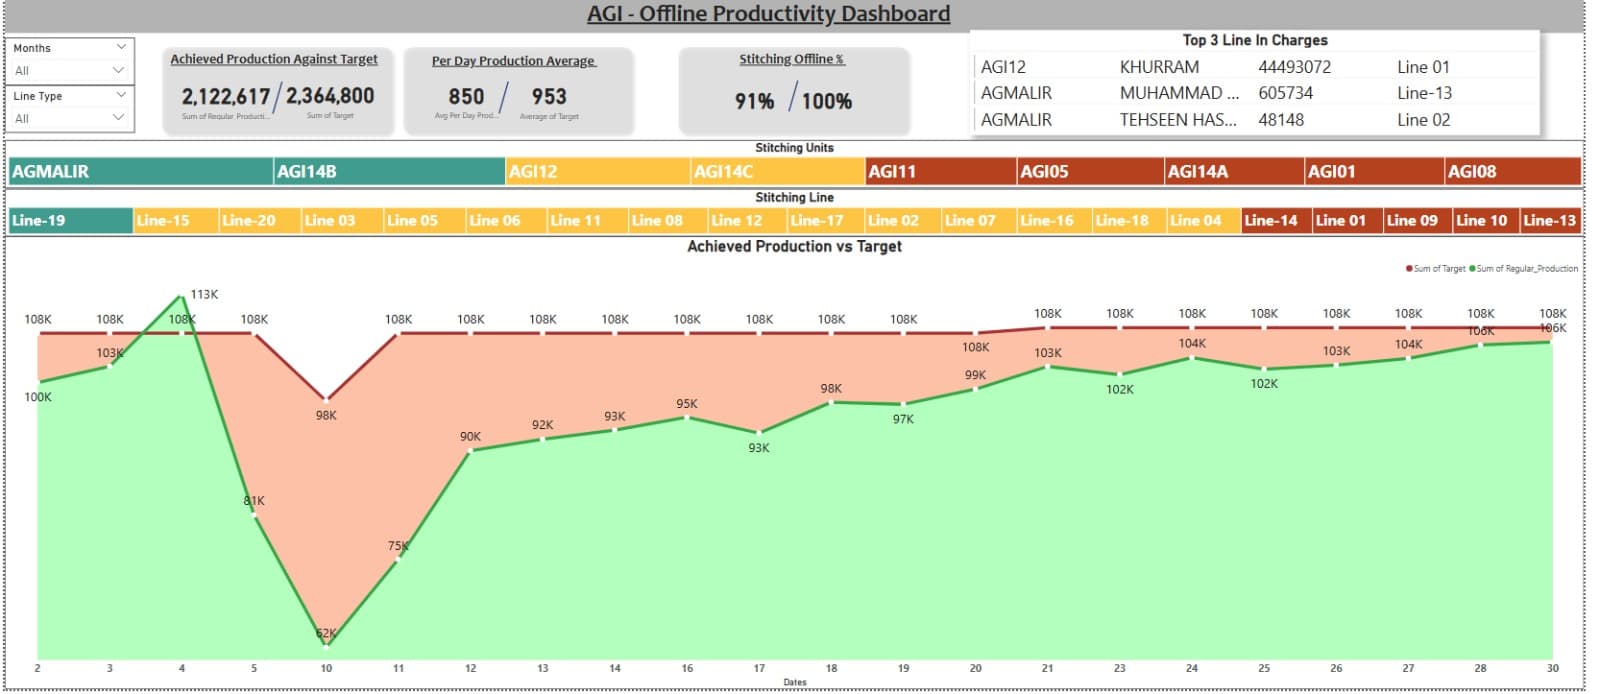
9/12/2025
141 views
0 likes
Stitching Offline Productivity Dashboard
Business Intelligence
🧮 AGI – Offline Productivity Dashboard
📊 Project Overview
This interactive dashboard was developed in Power BI to monitor and analyze stitching line productivity performance across multiple production units at AGI Denim. It provides real-time visibility into daily production against targets, enabling managers to quickly identify underperforming lines and take corrective actions.
⚙️ Key Features
- Achieved vs Target Production: Visual comparison of daily achieved output versus production targets.
- Unit & Line Performance Analysis: Breakdown of productivity by stitching units and individual lines.
- Top Performing Line In-Charges: Highlights top 3 line in-charges based on output.
- Dynamic Filters: Slicers for Month and Line Type to drill down into specific data segments.
- KPI Cards: At-a-glance metrics including total achieved production, total target, per day average, and stitching offline %.
📌 Insights Delivered
- Identifies bottlenecks and low-performing lines quickly.
- Helps management improve resource allocation and boost overall efficiency.
- Provides a centralized performance monitoring tool accessible to decision-makers.
🖼️ Dashboard Preview
Offline Productivity Overview
💻 Tools & Tech Used
- Power BI – Data modeling, visualization, and report building
- Microsoft Excel – Data cleaning and preparation
- DAX (Data Analysis Expressions) for KPIs and calculations
📁 Project Type
Business Intelligence | Data Analytics | Performance Monitoring